Architecture and Principle of the Monitor Console
DBCC is a data warehouse monitoring platform designed for SynxDB-like (MPP) database clusters. It aims to provide a unified, centralized, and visual monitoring solution for data warehouses and their operating environments.
Its core features include:
Automation: Automatically discovers and senses the node status and role changes of the data warehouse.
Comprehensive monitoring: Monitors key performance indicators within the database (such as sessions, queries, and locks) and system metrics of the node hosts (such as CPU, memory, and disk).
Intelligent alerting: Provides flexible alert rule configuration and integrates with mainstream industry alert processing components to achieve timely fault alerts and notifications.
Core architecture
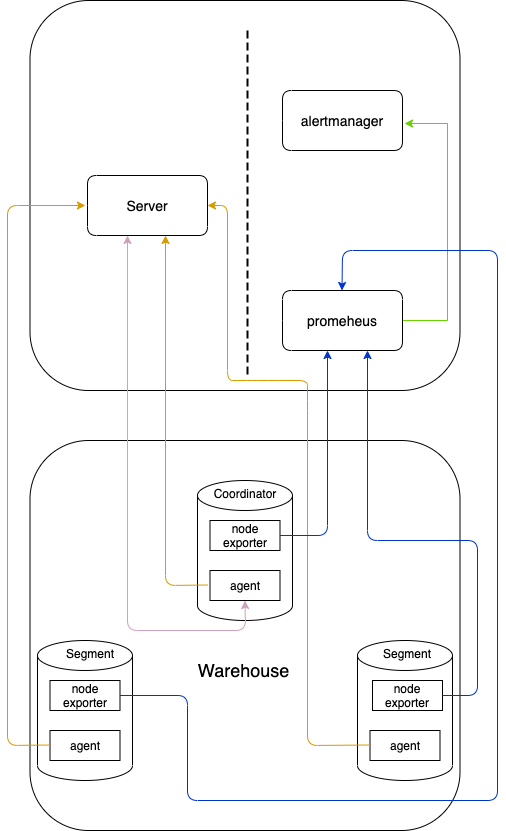
DBCC uses a primary-secondary architecture, consisting of a central DBCC Server and DBCC Agents deployed on each monitored database node. This architecture cleverly combines both push and pull models to achieve comprehensive monitoring and management.
Architecture diagram
Main components
DBCC Server (Master): As the control center, it does not directly connect to the monitored databases. Its main responsibilities include:
Managing the registration, heartbeat, and lifecycle of all Agents.
Providing a web UI (through a built-in frontend application) for users to view monitoring data and perform management tasks.
Acting as a proxy for frontend requests, forwarding user operation commands to the corresponding Agents for execution via gRPC.
Receiving and processing active alerts from Agents and forwarding them to Alertmanager.
Integrating with Prometheus and Alertmanager for metric storage and alert notification, respectively.
DBCC Agent (Slave): As an agent deployed on the database host, it is responsible for:
Actively registering with the Server and maintaining a heartbeat.
Executing commands sent from the Server (mainly database queries and operations).
Collecting system metrics of the host and performance metrics of the database, and exposing them in a Prometheus-readable format.
Monitoring specific events (such as coredumps) and actively reporting them to the Server.
DBCC Console (Frontend): A user interface built with React and TypeScript. It is ultimately packaged into static files and hosted by the DBCC Server, providing users with visual display of all monitoring data and system management functions.
Third-party components:
Prometheus: A leading time-series database in the industry, used to store all monitoring metrics collected by the Agents. The DBCC Server queries Prometheus to obtain historical data and charts.
Alertmanager: Responsible for handling alerts triggered by the DBCC Server or Prometheus. It deduplicates, groups, and silences alerts according to configured routing rules, and finally sends notifications via email, DingTalk, etc.
Workflows and principles
The system coordinates multiple components to complete monitoring and management tasks through several precisely defined workflows.
Agent registration (Push)
This is the first step for an Agent to come online, ensuring that the Server can discover and manage it.
After the Agent starts, its built-in
WarehouseNodeRegistrarworker begins to work.The worker connects to the local database to obtain the database’s unique identifier (System ID) and the current node’s role (Coordinator, Segment, etc.).
The Agent calls the Server’s
RegisterGrpcServiceinterface via gRPC to register, reporting its FQDN, IP, role, and other metadata.After receiving the registration information, the Server records this new node in its own database and associates it with a “Warehouse” entity. From then on, the Server is aware of the Agent’s existence and its basic information.
Metric collection (Pull)
This is the core source of monitoring data for the system, adopting the standard Prometheus pull model.
Inside the Agent, two workers,
NodeExporter(a third-party component) andDatabaseMetricsExporter, run in parallel and periodically.They collect operating system metrics (CPU, memory, etc.) and internal database metrics (active connections, locks, etc.), respectively, and write the results to local text files in real time.
The user’s Prometheus Server is pre-configured to periodically pull these metric data from the text files on all registered Agents via HTTP requests on a specific port.
Prometheus stores the fetched data in its time-series database. When a user needs to view monitoring charts in the frontend UI, the UI sends a request to the DBCC Server. The Server then queries Prometheus (using PromQL) for the required metric data, and finally aggregates, formats, and returns the results to the frontend for rendering.
Command execution (Proxy)
This workflow allows users to indirectly manage remote databases through a centralized UI, with the Server acting as a secure proxy and command forwarder.
A user performs an action in the frontend UI, such as “view all current sessions”.
The request first reaches the web interface of the DBCC Server. After authentication and authorization, it is routed to the corresponding gRPC service (for example,
QueryMonitorGrpcService).The Server parses the target data warehouse from the request and finds the Agent corresponding to the coordinator node of that warehouse based on the registration information.
The Server pushes the “list current sessions” command to the Agent through the established
MonitorGrpcServicegRPC bidirectional long-lived connection.The
CommandStreamworker on the Agent side receives the command and dispatches it to the correspondingHandler(for example,ListSessionHandler).The Handler executes the corresponding SQL query using the local database connection pool.
The query results are returned to the Server via the gRPC stream, and the Server then returns the results to the frontend UI for display.
Alert (Push)
The alerting system of DBCC is divided into two types: Metrics Alert and Event Alert. Together, they ensure a timely response to system anomalies.
Metrics alert
This process is based on Prometheus’s capabilities to evaluate collected time-series metrics and trigger alerts.
Prometheus continuously evaluates the collected metric data based on pre-configured alerting rules.
When a metric meets the threshold defined by a rule (for example, CPU usage is continuously above 90%), Prometheus generates an alert and pushes it to Alertmanager.
After receiving the alert, Alertmanager performs deduplication, grouping, and other processing, and then forwards the alert information to the DBCC Server via a webhook according to routing rules.
After receiving the webhook request, the Server pushes the alert to the corresponding contacts based on the pre-set contact notification channel configurations (for example, email, DingTalk).
Event alert
This process enables active, real-time reporting and notification of critical, non-metric-based abnormal events (such as coredumps).
An event monitoring worker on the Agent, such as
CoredumpMonitor, detects an abnormal event (for example, a newly generated coredump file).It immediately calls the Server’s
CoredumpMonitorinterface via gRPC to actively report the event.After receiving the alert event, the Server queries whether the corresponding alert rule is configured for the warehouse.
If the rule exists and is enabled, the Server constructs an alert message in a format compatible with the Alertmanager API and then pushes it to Alertmanager via an HTTP POST request.
After receiving the alert, Alertmanager forwards it to the DBCC Server via a webhook according to its configuration.
After receiving the webhook request, the Server pushes the alert to the corresponding contacts based on the contact’s notification channel configurations.