Cluster Status and Metrics
You can view the near-real-time status and metric data of the cluster on the Cluster Metrics and Cluster Status pages.
Note
DBCC supports monitoring multiple database clusters. You can switch between clusters using the dropdown menu in the top-right corner of the console.
Access the pages
To access the Cluster Metrics and Cluster Status pages, you need to:
Access the DBCC dashboard in your browser via
http://<cluster_node_IP>:8080/.Click Cluster Metrics or Cluster Status in the left navigation menu to enter the page.
View the overall status and data of the cluster
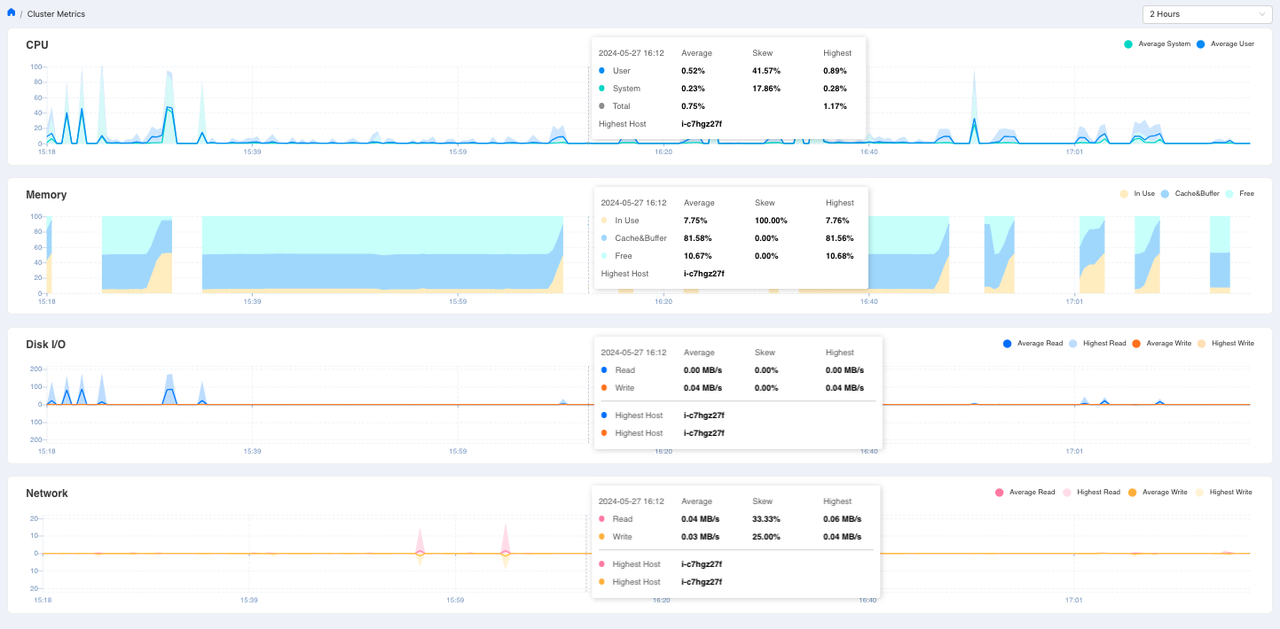
The Cluster Metrics page displays the cluster’s CPU, memory, disk I/O, and network data.
You can adjust the time range of the data displayed through the drop-down menu on the upper-right corner of the page. Available time range options are “2 hours”, “6 hours”, “1 day” and “7 days”. Data calculation time units vary with the selected time range.
The charts have time as the X axis and numerical value or percentage as the Y axis. When you hover over a certain time point, the data of that time will pop up. You can view data from different time points by moving the cursor horizontally. Corresponding legends are provided in the upper right corner of each chart.
Cluster CPU usage status
The chart displays the following metrics:
Average, skewness, and maximum value of the total CPU usage (%) of all user processes.
Average, skewness, and maximum value of the total CPU usage (%) of all system processes.
Average, skewness, and maximum of the total CPU usage (%).
Name of the busiest host.
Cluster memory usage status
The chart displays the following metrics:
Average, skewness, and maximum of the total memory in use (%).
Average, skewness, and maximum of the total buffer and cache memory (%).
Average, skewness, and maximum value of the total available memory (%).
Name of the busiest host
Cluster disk I/O rate
The chart displays the following indicators:
Average, skewness, and maximum value of the total disk read rate (MB/s).
Average, skewness, and maximum value of the total disk write rate (MB/s).
Name of the busiest host by disk read.
Name of the busiest host by disk write.
Attention
The part above the X axis of the chart displays disk read data, and the part below the X axis displays disk write data.
Network I/O rate
Average, skewness, and maximum value of the total network read rate (MB/s).
Average, skewness, and maximum value of the total network write rate (MB/s).
Name of the busiest host by network read.
Name of the busiest host by network write.
Note
The part above the X axis of the chart displays network read data, and the part below the X axis displays network write data.
View the status and data of nodes and hosts
The Cluster Status panel includes the Cluster Detail and Host Metrics tabs, which display the detailed status of the cluster and the operational metrics of each host, respectively.
Cluster metrics
The Cluster Detail tab is the core page for diagnosing the health of the cluster. On this page, you can quickly assess the overall operational status of the cluster and delve into the specific information of each segment node.
The top of the page provides a set of key indicators to help you quickly understand the overall status of the cluster:
VIP Status: Helps you confirms whether the cluster’s high-availability VIP is online.
Database State: Checks whether the overall database is in a
HEALTHYstate.Total Segments: Helps you quickly determine whether any segment nodes are offline by checking the number of
UpandDowninstances.
To locate problematic nodes or view more detailed node information, you can refer to the segment status list below. This list displays the detailed attributes of each segment instance:
Field |
Description |
|---|---|
Hostname |
The name of the segment host |
Address |
The address of the segment on the segment host |
Port |
The listening TCP port of the segment host |
DB ID |
Database ID |
Content ID |
The content identifier of the segment |
Status |
Segment status. Values: Up or Down |
Role |
The current role of the segment. Values: |
Preferred Role |
The role that is set for the segment when it is initialized. Values: |
Replication Mode |
The synchronization status of the segment with its mirror copy. Values: |
Host metrics
The Host Metrics tab displays data of the coordinator host, its backup host, and the segment hosts:
Note
Users can search for a specific segment host by hostname.
Field |
Description |
|---|---|
Hostname |
The name of the coordinator or segment host |
CPU User/System/Idle |
% of the user processes CPU usage, system processes CPU usage, and idle CPU |
Memory in Use (GB) |
In-use and available memory |
Disk R (MB/s) |
Disk read rate |
Disk W (MB/s) |
Disk write rate |
Net R (MB/s) |
Network read rate |
Net W (MB/s) |
Network write rate |
Bind virtual IP
To ensure high availability for the coordinator node, DBCC allows you to bind a virtual IP (VIP). A VIP is an IP address that is not tied to a specific physical network interface. When a primary node failure occurs, the VIP automatically transfers to the standby node, ensuring uninterrupted service and preventing console access disruption from a single point of failure.
To bind a VIP, follow these steps:
Log in to the DBCC console.
In the left navigation bar, click Cluster Status to go to the cluster details page.
Click Bind VIP in the upper-right corner of the page to open the Bind VIP window.
In the Bind VIP window, select a network device, enter an IP address, and then click Confirm to bind the VIP.